Pages

Thursday, 26 December 2013

Your "2013" Top Ten

It's nearing the end of the year so I thought I'd publish a list of the ten most viewed articles published this year. Like last year, I realised that this would be skewed in favour of older articles. So, in an effort to bring balance, I decided to look at the posts I'd published in the last 18 months and highlight the ten most viewed. And when I come to do that in a years time, the last half of 2013 will get its fair crack of the whip. Does that make sense?

Anyway, here they are (with the most popular at the top of the list)...

1.NOTE: Booked and Ready for SAS Global Forum 2013 (06-Feb-2013)
2.NOTE: DS2, Learn Something New! (11-Feb-2013)
3.NOTE: DS2, Threaded Processing (18-Feb-2013)
4.NOTE: DS2, SQL Within a SET Statement (13-Feb-2013)
5.NOTE: Best Contributed Paper Awards from SAS Global Forum 2013 (07-Jun-2013)
6.NOTE: DS2, Final Comments (20-Feb-2013)
7.NOTE: DS2 Final, Final Comments (27-Feb-2013)
8.NOTE: Executing a PROC from a DATA Step, Revisited (14-Jan-2013)
9.NOTE: SAS 9.4 is Functioning Well (15-Jul-2013)
10.Affinity Diagrams for Problem Solving (15-May-2013)

It's interesting to see so many of my DS2 articles in the top ten. It shows a keen interest in the topic. Aside from that, I was glad to see one of my articles taken from my SAS Global Forum paper make the top ten (Affinity Diagrams).

Are any of your favourites in the list?

I hope you had a good Christmas. Here's to a healthy and happy New Year.

Thursday, 19 December 2013

NOTE: Have You Won Yet?

Are you checking the SAS advent calendar daily, and entering the prize draw? Have you won anything yet? I have not, but I did win a very informative book a couple of years ago.

Opening the windows in the advent calendar is an annual treat. Last year SAS gave us an additional treat - a game for Apple iOS and Google Android devices. I think it's time I dusted it off and got back into practice before challenging the kids over Christmas!

Tuesday, 17 December 2013

Regression Tests, Holding Their Value

Last week I wrote about how our test cases should be considered an asset and added to an ever growing library of regression tests. I had a few correspondents ask how this could be the case when their test cases would only work with specific data; the specific data, they said, might not be available in the future because their system only held (say) six months of data.

It's a fair challenge. My answer is: design your test cases to be more robust. So, for instance, instead of choosing comparison data from a specific date (which might eventually get archived out of your data store), specify a relative date, e.g. instruct your tester to refer to data from the date preceding the execution of the test. Test cases have steps, with expected results for each step. Begin your test case by writing steps that instruct the tester to refer to the source/comparison data and to write down the values observed. In your subsequent steps, you can instruct your tester to refer to these values as expected results.

Other correspondents said that their tests were manual, i.e. using a user interface and clicking buttons, and hence couldn't be re-run because they were too time-consuming. In this case, I draw attention to my observations about a) deciding what degree of confidence the test exercise should engender in the modified system, and b) deciding what tests need be (re)run in order to provide the confidence. It's fine to choose not to re-run some of your regression tests, but be aware that you're making a decision that impacts the degree of confidence delivered by your tests.If sufficient confidence is delivered without rerunning the manual steps then all is good; if not, you need to revisit your decisions and get them back into balance. There's often no easy answer to this balancing act, but being open and honest about time/effort/cost versus confidence is important.

The longer term answer is to try to increase the number of automated tests and reduce those needing manual activity. But that's a topic for another day!

Wednesday, 11 December 2013

Test Cases, an Investment

It never ceases to frustrate and disappoint me when I hear people talking of test cases as use-once, throwaway artefacts. Any team worth its salt will be building a library of tests and will see that library as an asset and something worth investing in.

Any system change needs to be tested from two perspectives:
  1. Has our changed functionality taken effect? (incremental testing)
  2. Have we broken any existing functionality? (regression testing)
The former tends to be the main focus, the latter is often overlooked (it is assumed that nothing got broke). Worse still, since today's change will be different to tomorrow's (or next week's), there's a tendency to throw away today's incremental test cases. Yet, today's incremental test cases are tomorrow's regression test cases.

At one extreme, such as when building software for passenger jet aircraft, we might adopt the following strategy:
  • When introducing a system, write and execute test cases for all testable elements
  • When we introduce a new function, we should write test cases for the new function, we should run those new test cases to make sure the new function works, and we should re-run all the previous test cases to make sure we didn't break anything (they should all work perfectly because nothing else changed, right?)
  • When we update existing functionality, we should update the existing test cases for the updated function, we should run those updated test cases to make sure the updated function works, and we should re-run all the previous test cases to make sure we didn't break anything (again, they should all work perfectly because nothing else changed)
Now, if we're not building software for passenger jets, we need to take a more pragmatic, risk-based approach. Testing is not about creating guarantees, it's about establishing sufficient confidence in our software product. We only need to do sufficient amounts of testing to establish the desired degree of confidence. So there are two relatively subjective decisions to be made:
  1. How much confidence do we need?
  2. How many tests (and what type) do we need to establish the desired degree of confidence?
Wherever we draw the line of "sufficient confidence", our second decision ought to conclude that we need to run a mixture of incremental tests and regression tests. And, rather than writing fresh regression tests every time, we should be calling upon our library of past incremental tests and re-running them. And the bottom line here is that today's incremental tests are tomorrow's regression tests - they should work (unedited and without modification) because no other part of the system has changed.

Every one of our test cases is an investment, not an ephemeral object. If we're investing in test cases and managing our technical debt, then we are on the way to having a responsibly managed development team!

'Tis the Season of Lists

December is the time when the media industry tends to offer more lists than the other 11 months of the year. One that caught my eye was the TIME magazine Top 10 gadgets of 2013. These kind of lists are always good for spurring conversation down the pub. For instance, I was surprised that Google Glass didn't get a mention, but I guess it's not yet a consumer product. On the other hand, I wasn't surprised at all to see a smart watch in the list. Smart watches didn't quite hit the mainstream in 2013, but I'm sure we'll see a lot more (cheaper and more functional) in 2014.

It was also interesting to look back at TIME's all-time 100 gadgets from 2010. Whilst all the items in the list were leading-edge at the time they were introduced, it's quite startling to see the pace of technological change, i.e. how dated the items in the list are (even the most recent ones from 2009/10) by 2013 standards.

The pace of change in our own industry is barely any slower. Traditional skills such as SAS/BASE and SQL programming are still in demand, but broader and deeper knowledge is increasingly in demand, whether it be for other languages like SAS DS2, Pig or Hive, or whether it be visual coding in Enterprise Guide or Data Integration Studio, or whether it be SAS architecture (significantly changed again in V9.4), or whether it be data analytics. Whatever your role, be sure to be thinking how to keep up with developments and how to keep your skills up-to-date.

Tuesday, 10 December 2013

NOTE: Reverse-Engineering Technical Debt

I wrote a couple of items about technical debt back in November (here and here). Sometimes you don't choose to create debt for yourself, sometimes it's inherited. In technical guises, debt can be inherited when teams merge, for instance.

In such circumstances, it can be difficult to know how much debt has been inherited. In these cases, reverse engineering tools can be of use. I'm thinking in particular of Complementsoft's ASAP.

ASAP takes SAS/BASE source code and produces process flow and data flow diagrams. In other words, it works in the reverse direction to tools such as Enterprise Guide and DI Studio - these tools allow you to draw flows and then the tools generate SAS/BASE code from your diagrams. ASAP takes your code and produces diagrams.

In fact, ASAP can read your program source code or your SAS log. Reading the log is especially useful when you're using macros with conditional logic that will generate different SAS/BASE code dependant upon input data.

In addition to creating diagrams from your code and logs, ASAP has an in-built editor and remote code-submission capabilities, so it can form a complete code development and execution environment. And, it allows you to quickly skip between nodes in diagrams and the associated DATA step or procedure in your source code or log.

There aren't many SAS-related third-party products available to SAS customers. ASAP is one of the few and I'm pleased to be able to give it a mention in the NOTE: blog. If you'd like to see more, take a look at the "demo" on the ComplementSoft web site, and take advantage of their free trial.

Wednesday, 4 December 2013

NOTE: Enterprise Guide vs DI Studio - What's the difference?

A favourite interview question of mine is: Compare and contrast SAS 9's stored process server and workspace server. This question is very good at revealing whether candidates actually understand some of what's going on behind the scenes of SAS 9. I mentioned this back in 2010, together with some notes on my expectations for an answer.

I was amused to see Michelle Homes post another of my favourite interview questions on the BI Notes blog recently: What’s the difference between SAS Enterprise Guide and SAS DI Studio? This question, and the ensuing conversation, establishes whether the candidate has used either or both of the tools, and it reveals how much the candidate is thinking about their environment and the tools within.

For me, there are two key differences: metadata, and primary use.

Michelle focuses on the former and gives a very good run-down of the use of metadata in Data Intergration Studio (and the little use in Enteprise Guide).

With regards to primary use, take a look at the visual nodes available in the two tools. The nodes in DI Studio are focused upon data extraction, transformation and loading (as you would expect), whilst the nodes in Enterprise Guide (EG) are focused upon analysing data. Sure, EG has nodes for sorting, transposing and other data-related activities (including SQL queries), but the data manipulation nodes are not as extensive as DI Studio. In addition to sorting and transposing, DI Studio offers nodes that understand data models, e.g. an SCD loader and a surrogate key generator (I described slowly changing dimensions (SCDs) and other elements of star schema data models in a post in 2009). On the other hand, EG has lots of nodes for tabulating, graphing, charting, analysing, and modelling your data.

One final distinction I'd draw is that EG's nodes are each based around one SAS procedure, whilst DI's nodes are based around an ETL technique or requirement. You can see that DI Studio was produced for a specific purpose, whilst EG was produced as a user friendly layer to put on top of the SAS language and thereby offers a more generalistic solution.

For the most part, I'm stating the obvious above, but the interview candidate's answer to the question provides a great deal of insight into their approach to their work, their sense of curiosity and awareness, and their technical insight.

Tuesday, 3 December 2013

NOTE: Tips to Avoid the Bus

Back in 2011 I wrote about the Bus Factor, i.e. the minimum number of people on your project (or in your support team) whose loss would cause serious issues for your project/support team. The name of this factor derives from the possibility of one or more team members getting hit by a bus. An alternative (less tragic) name - highlighted by Angela Hall at the time - is "lottery factor", i.e. we assume that one or more people got a big win on the lottery and immediately left work, never to return. Either way, it's a serious factor and must be managed.

At the time, I offered a number of techniques to help increase your team's bus factor (a good thing). Here are a few more that I use, all focused on the greater sharing of knowledge. If you ingrain the techniques of active and deliberate knowledge sharing into your team members then you need worry less about your bus factor, but don't completely take your eye off the ball - remember to manage it.

Push-Based Knowledge Sharing. The person who holds the knowledge about something asks a person who does not know about it to join them to learn about it. They thereby PUSH the information towards the other person.

Pull-Based Knowledge Sharing. The person who does not have knowledge about something asks another person who knows about it to teach them about it in some way. In this way, they establish a PULL of the information from the other person.

Knowledge-Share Handshaking. Having only a single direction knowledge sharing culture, i.e. only pull or only push, is not the most effective culture. There has to be a knowledge handshake for knowledge to freely flow through. Encompassed within handshaking is the idea of pairing. One of the best ways to remove bus factors, is by pairing. Pairing is an act of implicit learning where knowledge is constantly back and forth. On the other hand, if a person asks a question “How did you do that?” then that is an act of explicit learning.

Pairing is hard to achieve in organisations where pairing was never a “thing” people do. If you cannot get enough people to pair, or the bus factor is happening when a person from a different team knows something that your team replies on, it’s time to start encouraging implicit knowledge gathering, or implicit learning.

NOTE: Advent Calendar 2013

I bring good news! The SAS Professionals advent calendar is now working nicely. Open a new window each day to stand a chance of winning great prizes.

Sunday, 1 December 2013

NOTE: Whither the Advent Calendar?

It's traditional for me to mention the SAS Professionals advent calendar at this time of year. However, this year it seems to have stalled. Clicking the #1 today tells me that I need to wait for the correct date.

I'll post an update as soon as I have more information.

On the plus side, I'm pleased to see that Smooth Radio Christmas has recommenced broadcasting (on the internet, but not DAB this year). With the demise of Smooth Radio 70s in October I was afraid that the Christmas station might meet the same fate. Fortunately not, but I'm sad I can't listen to it in the car on DAB - I've found no replacement either.

If the music of Smooth is not to your taste, consult a list of Christmas radio stations. There's a good range. My kids favourite is North Pole Radio.

Tuesday, 26 November 2013

More on Technical Debt #2/2

Last week I offered some techniques for management of technical debt. In this post I offer some more.

Technical debt is a debt that you incur every time you avoid doing the right thing (like refactoring, removing duplication/redundancy), thereby letting the code quality deteriorate over time. As with financial debt, it is the easy thing to do in the short term; however, over time, you pay interest on this debt - the code quality deteriorates over time. And as with real debt, it can be used beneficially if managed well.

1. Refactor technical debt away. Apply several forms of refactoring, including code refactoring, data model refactoring, and report interface refactoring. Refactorings are typically very small, such as renaming an operation or splitting a data mart column, so should just be part of everyday development. Rework, on the other hand, is more substantive and should be explicitly planned. The Architecture owner (see below) will often negotiate rework-oriented work items with the Product Owner (the person on the team who is responsible for prioritising the work).

2. Regression test continuously. One of the easiest ways to find problems in your work is to have a comprehensive regression test suite that is run regularly. This test suite will help you detect when defects are injected into your code, enabling you to fix them, or back out the changes, right away.

3. Have an explicit architecture owner. The Architecture Owner (AO) should be responsible for guiding the team through technical decisions, particularly those at the architecture level. AOs often mentor other team members in design skills, skills that should help them to avoid injecting new technical debt into the environment. They should also be on the lookout for existing technical debt and where appropriate motivate the team to address that technical debt when appropriate.

4. Do a bit of up front thinking. Develop a technical strategy early-on in your project. By thinking through critical technical issues before you implement your solution, you have the opportunity to avoid a technical strategy which needs to be reworked at a future date. The most effective way to deal with technical debt is to avoid it in the first place.

5. Be enterprise aware. Good development teams are enterprise aware, realising that what they do should leverage and enhance the overall organisational ecosystem. They will work close with your enterprise architects, so that they can take advantage of existing IT assets. An important strategy for avoiding technical debt is to reuse existing assets and not rebuild or rebuy something that you already have.

Manage your debt and it will pay you back; pay no attention to it and you may end-up with a credit bubble!

Sunday, 24 November 2013

200,000 and Growing

Yay! We just topped 200,000 hits on the blog. Since I started it in 2009, I've posted 433 posts on the NOTE: blog. I'm humbled that people continue to find the content interesting. Keep tuning in!

Tuesday, 19 November 2013

More on Technical Debt #1/2

Last year I introduced the topic of technical debt. Technical debt is a debt that you incur every time you avoid doing the right thing (like refactoring, removing duplication/redundancy), thereby letting the code quality deteriorate over time. As with financial debt, it is the easy thing to do in the short term; however, over time, you pay interest on this debt - the code quality deteriorates over time. And as with real debt, it can be used beneficially if managed well.

I thought I'd list a few of the techniques I use to manage debt. I'll list five here, and offer some more in a subsequent post.

1. Reduce the debt before implementation. Passing systems with high technical debt to other teams, such as a systems operation team is generally a bad practice. It should be ingrained in your culture that each team is responsible for keeping the quality of their solutions high. It is reasonable to expect maintenance groups to resist accepting systems that have high technical debt.

2. Some technical debt is acceptable. Sometimes you will decide to explicitly accept some short term technical debt for tactical reasons. Perhaps there is a new component or framework about to be delivered by another group in your organisation, so you’re writing a small portion of what you need for now until you can replace it with the more robust component. Regardless of the reason, part of the decision to accept technical debt is to also accept the need to pay it down at some point in the future. Having good regression testing plans in place assures that refactoring accepted technical debt in the future can be done with low risk.

3. Measure technical debt. If you are serious about technical debt then you must measure it and, more importantly, keep an eye on the trends (which should be going down over time). Keep a log of technical debt that identifies each element.

4. Explicitly govern your technical debt. For your organisation to succeed at reducing technical debt it must be governed. This means it needs to be understood by senior management, measured (see previous point), and funded.

5. Make the reduction of technical debt part of your culture. Technical debt isn't going to fix itself, and worse yet will accrue "interest" over time in the form of slower and more expensive evolution of your system.

As with real debt, technical debt can be used positively if it is well managed. Using the above techniques will help you to manage it.

Read more:
More on Technical Debt #2/2

Monday, 18 November 2013

NOTE: Additional SAS Professionals in London

Whilst the scheduling of the international Analytics 2013 event in London in June (hosted by SAS) precluded the annual SAS Professionals conference, we're being treated to a series of SAS Professionals Roadshow events in Marlow, London and Dublin (and Scotland and Manchester early next year). I attended the Marlow event in October and found it most informative. I wrote about it at the time (here, here and here).

It seems that the upcoming London event has proved more popular than anticipated and so SAS have added an extra date. December 11th is sold-out, but December 12th is now available to be booked. The SAS Professionals web site has full details. If you're not already signed-up for a date, don't miss your opportunity for the new date. Book ASAP!

NOTE: More Agility at SAS

Last month I featured an article by SAS's Tim Arthur regarding the adoption of agile techniques at SAS. Tim promised to produce another article in November, and he has been good to his word.

In 5 More Ways SAS Scaled Agile Scrum, Tim focuses on coaching options, communication, scale, and closing the loop. All of these topics are focused on increasing the adoption of agile around the organisation. Judging by the speed with which new versions of Visual Analytics are being released, the agile approach is making a positive difference at SAS.

Good tips from Tim. I'd add the following that are specifically related to agile planning:
  • Split the project into short iterations. By working in short iterations of 2 - 4 weeks each, and being sure to deliver working software at the end of each, you get a true measure of your progress

  • Only create detailed plans for imminent tasks. Schedule in detail weeks ahead but not months; use a high-level plan for the months ahead. In practice, this usually means producing a detailed plan for the next couple of iterations

  • Ensure the people doing the work are actively involved in scheduling. They have the skills and knowledge, plus the motivation to get it right. And it ensures they buy in to the plan

  • Allow people to choose their work, don't assign it. Again, this ensures commitment and buy-in

  • Take a requirement-centred approach. Centre your plan around delivering features or user stories rather than the traditional design, build, test activities

  • Remember training. If agile is new to your enterprise, remember to include training for new staff, and refresher sessions for existing staff
Good luck with your agile project.

Thursday, 14 November 2013

NOTE: Interactive Metadata-Bound Libraries (MBLs)

Further to my recent note on SAS V9.4 updates, Metacoda's Paul Homes recently highlighted something that had slipped my attention: a point-and-click interface for creating metadata-bound libraries (MBLs).

In Paul's Creating a Metadata Bound Library with SAS 9.4 article he describes the SAS management console method for interactively defining an MBL, thereby avoiding the need to use PROC AUTHLIB. I mentioned this in an article in May this year but had overlooked it since.

I'm a big fan of metadata-bound libraries and, as Paul says, "this is a great addition to SAS Management Console 9.4" and it will certainly increase the take-up and use of MBLs. Paul's article contains a step-by-step guide to using this feature, along with plenty of screenshots.

Wednesday, 13 November 2013

NOTE: Visual Analytics to Replace PowerPoint?

I noted Tricia Aanderud's recent post on BI Notes with a wry smile: Can SAS Visual Analytics Replace PowerPoint for a Small Business? The question seems incredulous, yet when I read Tricia's article in full, I could see sense in the train of thought that Tricia and some of her clients were propounding.

If you spend a lot of time preparing slide decks full of charts, read Tricia's article and see if you might support her argument too. It's certainly thought-provoking, and amply demonstrates many benefits of Visual Analytics.

NOTE: SAS Talks Archive - A Treasure Trove of Training Goodness

In last week's post on Enterprise Guide custom tasks I mentioned a video in the SAS Talks archive. Some of you wrote to me to say that the archive was difficult to find; I have to agree.

SAS Talks is an ongoing series of monthly webinars from SAS. The subject matter is wide and varied. The presenters range from SAS's own staff through to SAS customers. The topics are generally technical and range from Base SAS syntax though to use of Enterprise Miner and Enterprise Guide.

You can view the upcoming schedule from the SAS Talks web page; be sure to register if you intend attending an upcoming session.

The SAS Talks home page also includes links to a curated set of highlights, but if you really want to dig into the treasure trove of sessions, you need to look for the link to the archive in the introductory paragraph at the top of the page, or click the link at the very bottom of the page.

To receive email information about new talks, you can subscribe.

See also the Expert Channel at SAS Professionals, another veritable vault of valuables.

Note to self: alter your approach with regard to articles, all of this alliteration is alarmingly annoying some of the audience!

Tuesday, 5 November 2013

NOTE: Spicing-Up Your Enterprise Guide With Custom Tasks - Checking Cardinality

Last week I wrote about a couple of neat custom tasks from Metacoda that would allow you to search metadata from within Enterprise Guide (EG) and the Add-In for Microsoft Office (AMO). Custom tasks are a great way to augment the functionality you get in EG and AMO.

I recently saw Chris Hemedinger write in The SAS Dummy blog about a custom task to check cardinality that he'd written. If you're into hierarchies, dimensions or forms of analytics, cardinality is doubtless a frequently used part of your vocabulary. In essence, cardinality of a variable specifies the number of distinct values of that variable.

Back in May, Chris published some good advice about installing custom tasks, taking into account changes made in EG 5.1 and later. Worth a read.

If you're new to the idea of custom tasks, the SAS Talks archive contains a one hour Introduction to Custom Tasks video from earlier this year.

If you would like to broaden your knowledge of custom tasks and start to write some for yourself, I highly recommend Chris's book Custom Tasks for SAS Enterprise Guide using Microsoft .NET. Examples from the book (with source) are available too.

All-in-all, if you haven't already given attention to custom tasks, you've no longer got any excuse to ignore them!

Tuesday, 29 October 2013

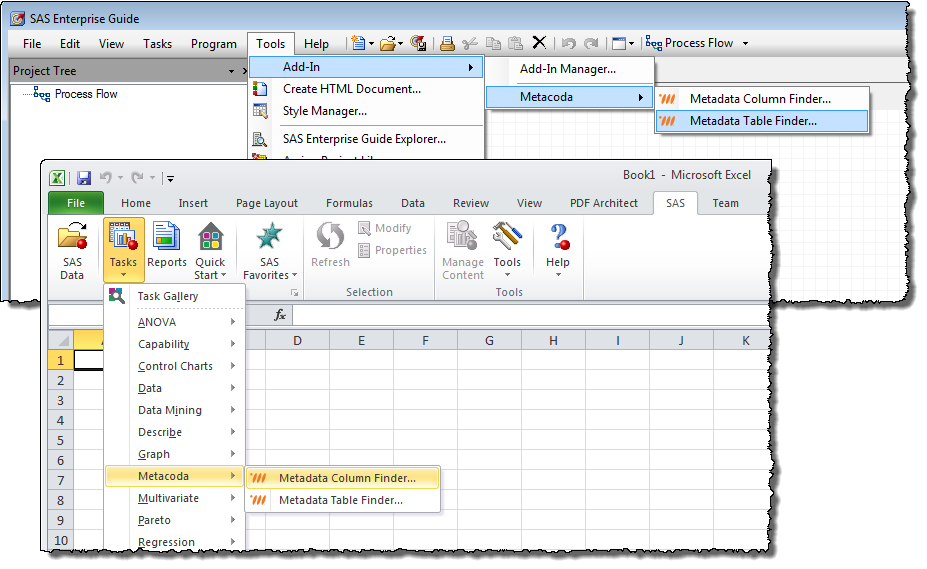
NOTE: Where Did It Go? - Metacoda's New Table Finder and Column Finder

Metadata is supposed to help you organise and manage your data, right? And it does, to an extent, but metadata search utilities are few and far between, and not always available right where you want them. Metacoda recently released a pair of custom tasks for use in Enterprise Guide and the Add-In for Microsoft Office which go a long way towards resolving the situation.

The two custom tasks are:

Metadata Table Finder: search for a table from all of the tables registered in metadata

Metadata Column Finder: search for a column from all of the table columns registered in metadata

Both tasks allow you to type in a keyword or phrase relating to the table or column you’re looking for. They then search the SAS metadata and display the results, showing where the matching objects can be found. They search metadata rather than the dictionary tables and hence they find tables and columns in any metadata-defined library - even those which have not yet been assigned. Metadata permissions will naturally limit the scope of your search.

The custom tasks work equally well with versions 5.1 and 6.1 of Enterprise Guide and the Add-In for Microsoft Office.

Both custom tasks are free-of-charge to those registered with Metacoda. See the product page for more details on the custom tasks and a link to register with Metacoda.

These custom tasks are a welcome addition to any SAS practitioner's armoury.

Thursday, 24 October 2013

Data Viz Web Sites

I'm currently leading a procurement project for one of my regular clients. The client has a very valuable manufacturing monitoring system with a dashboard which allows the client's manufacturing staff to monitor production trends on a daily basis - picking up data from a variety of source systems along the product manufacturing lifecycle.

Whilst the client's products all meet their manufacturing specification limits (and, hence, are good to go the distribution channel and consumers), the dashboard uses statistical process control (SPC) rules to provide automatic warnings when one or more production processes are drifting away from their central point of operation. Hence, the client's staff get an early warning and can bring the process back on track before it ever goes wrong.

My client wants to make a step change in their capability with regard to a) ability to perform more complex statistical process control activity, and b) data exploration, analysis and visualisation for circumstances where the root cause of the process drift is not immediately apparent. The step change may require software tools that are more advanced and sophisticated than their current reporting tool can provide. Thus, I'm running a gap analysis of their requirements against their current technology, and I'll be running a product selection exercise if/when gaps are found.

It's an interesting context and an interesting challenge, and I'm looking forward to driving our progress over the next few weeks and months.

To get to the point...

Whilst reviewing the market for visualisation and analytics products, I came across this neat list of visualisation sites on the Guardian web site within their ever interesting Data Store section. None of them are products, so they're no real help with my client's needs, but they are a good source of visualisation ideas. Take a look and tell me what you think...


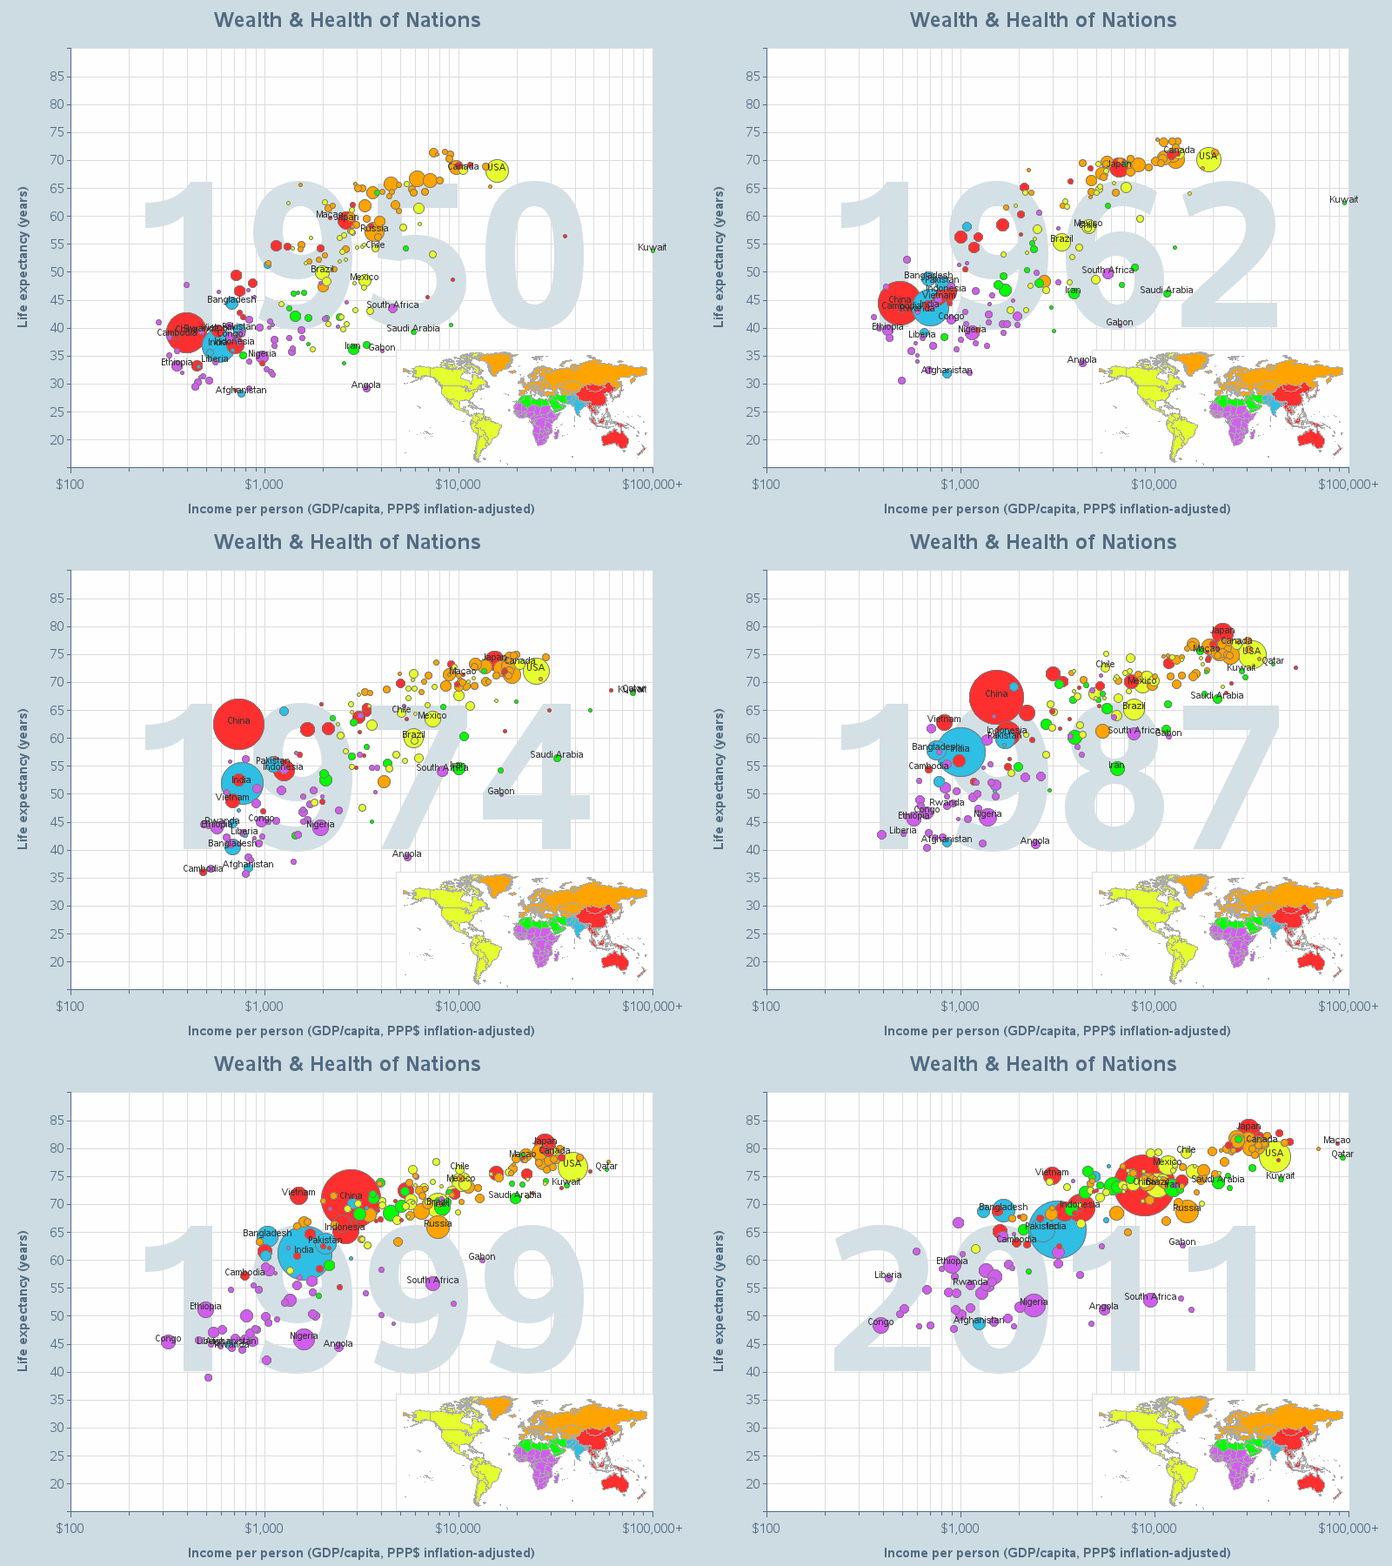
Of course, no mention of data visualisation is complete without a reference to Hans Rosling's fabulous treatise on health versus wealth for 200 countries over 200 years which I featured back in December 2010.

NOTE: EBI V4.4. Extra

Last week I wrote about what I'd learned about SAS Enterprise Business Intelligence (EBI) V4.4. at the recent SAS Professionals Roadshow.

I highlighted that traditional Web Report Studio reports will be available through the SAS Mobile BI app. Metacoda's Michelle Homes commented and added that the documentation says you don't have to perform any post-installation tasks to enable mobile reporting. That's great news. Thanks for reading the documentation on my behalf, Michelle!

There are just one or two types of Web Report Studio reports that cannot (yet) be surfaced via the Mobile BI app. These are documented at the link below (supplied by Michelle):

http://support.sas.com/documentation/cdl/en/biwaag/65229/HTML/default/viewer.htm#p1oo4k0eftlvipn1jm201adrl74n.htm

Wednesday, 16 October 2013

NOTE: Increasingly Agile

I'm a keen follower of SAS's adoption of Agile delivery techniques. I've posted articles on the subject in the past. You'll have noticed how SAS are releasing new version of Visual Analytics every six months; this is a good example of the benefits of Agile.

Since my earlier article, SAS's Tim Arthur has published a couple more articles on the subject. How is Being Agile Different From Doing Agile was published in July, and 5 Ways SAS Scaled Agile Scrum was published earlier this week. Both are highly informative regarding Agile in general and SAS's use in particular.

Tim intends to publish more information next month, so stay tuned!

Tuesday, 15 October 2013

NOTE: EBI V4.4

Last week I wrote-up some notes from part of the SAS Professionals Roadshow from earlier in October. Aside from the V9.4 update, I also attended the Enterprise Business Intelligence (EBI) update. Here are my notes:

  • V4.4 is the latest version
  • Google Chrome (and one or two other browsers) is now supported alongside Internet Explorer
  • It's worth noting that SAS/SECURE is now part of SAS/BASE and accessible to EBI
  • EBI integration is now available with the SAS Mobile BI app on Apple iOS and Google Android. The app can use relational web reports (srx) without the need for Visual Analytics (VA). OLAP is not currently supported, only relational reports. To use this feature, just login to the metadata server from the app, navigate the metadata folders to find your srx report, and subscribe to the report
  • In addition to mobile access to VA reports and relational srx reports, the Roambi relationship continues for 9.4
  • The BI Dashboard now remembers your last position and offers greater interaction with stored processes, i.e. a limited selection of prompts
  • Support for office 2013 (back to 2007) is provided
  • SAS Web Parts for Microsoft SharePoint now includes the ability to view of Web Report Studio srx reports, BI dashboards, stored processes, and VA reports 
  • Enterprise Guide 6.1 is new, yet it can be co-installed alonside 5.1
  • EG 6.1 has an improved scheduler with triggers and actions
  • EG 6.1 has a completely standalone installer - so there's no need to install it from a large depot
  • EG 6.1 supports SAS 9.2 onwards
All-in-all, a valuable session.

Wednesday, 9 October 2013

NOTE: A Stable Platform for 8 Years

Back in 2011, IBM announced their intent to purchase Platform Computing. You may recognise Platform Computing as the suppliers of SAS's solutions for scheduling (LSF) and grid management. At the time of the announcement it was not clear what the impact on SAS's relationship with Platform Computing might be.

The good news, I recently discovered, is that SAS signed a new 8 year deal with IBM and Platform Computing last year. So, we can rest assured that our investments in SAS's solutions for scheduling and grid management are secure and have a long-term perspective.

The functionality of Platform RTM, i.e. management of the SAS grid, has been built into the new SAS Environment Manager.

Tuesday, 8 October 2013

NOTE: More on 9.4

I had the pleasure of attending the SAS professionals Roadshow in Marlow last week. It was a good event: well organised, and informative. I'm looking forward to attending the similar event in London on December 11th so that I can join alternative information streams.

The event started with a detailed summary of SAS V9.4's new features. I'll repeat what I consider to be the highlights here.

  • New ODS destinations include HTML 5 (a strategic direction for many SAS customers) and PowerPoint (so that you can create a sequence of slides with charts and tables)
  • PROC ODSLIST, ODSTEXT and ODSTABLE can be used to make the creation of your ODS output simpler and neater
  • PROC JSON is useful for those who want to read data from a SAS data set and write it to an external file in JSON representation. Java Script Object Notation (JSON) is a text-based, open standard data format that is designed for human-readable data interchange
  • SAS/ACCESS includes support for SAP's HANA in-memory, MPP database
  • The HPxxxx procedures are part of SAS/BASE, SAS/STAT, etc. They use all available threads (albeit, the number of threads can be limited if required). In the vast majority of cases, you can simply edit your code and place "HP" on the front of the name of your compute-intensive PROCs to deliver multi-threaded processing
  • Visual Analytics reports can be delivered via the SAS Add-In for Microsoft Office
  • In the area of security, metadata bound libraries are a huge boon, but 9.4 also brings more encryption for data in flight and at rest
  • DS2 and FedSQL are two new languages introduced by 9.4. DS2 allows SAS syntax (including first. and last.) to be used and deployed within your multi-threaded database; FedSQL can break open a query and send it to multiple databases. The idea of executing FedSQL within DS2 makes my mind boggle - but it is possible
  • Metadata clustering brings increased resilience
  • 9.4 brings a new proprietary SAS mid tier, i.e. a mid-tier supplied and supported by SAS whihc replaces the rag-tag collection of 3rd-party components previously required for web servers, load balancing, app servers, content servers, etc. The new mid-tier is produced by VMware and branded by SAS. This is a recognised industry standard, but lighter in weight than the previous collection of components - reflecting SAS's actual use of the mid-tier. 
  • Since the introduction of V9, the SAS architecture has been a smorgasbord of 3rd party mid-tier products. SAS have steadily brought it all back in house. It's good to see this reach a conclusion
  • SAS Environment Manager (SEM) takes a bow and provides in-browser control of key SAS components. Ultimately, by the time V9.5 arrives, Environment Manager will have replaced SAS Management Console (SMC), but for the moment SEM and SMC will co-exist in our V9.4 environments. SEM is a single, pluggable architecture that is scriptable 
  • On the thorny subject of SAS metadata migration, SAS are offering a direct migration path from 9.2 and 9.3 to 9.3, but if you're still on 9.1 then you'll need to migrate to 9.2 or 9.3 before migrating to 9.4
So, there's something for everyone in V9.4, and there was something for everyone at the SAS Professionals Roadshow. Will I see at the London Roadshow in December?

Monday, 15 July 2013

NOTE: SAS 9.4 is Functioning Well

The unveiling of a new version of SAS always brings big, exciting new features and capabilities, but I love checking-out the detail too. New functions (and new function parameters) invariably provide interest too.

SAS 9.4 brings the DS2 language; Powerpoint and HTML5 as ODS destinations: customised attributes for data sets; the ability to write to a Sharepoint library; the direct ability to read zip files; clustered metadata servers; and much more. But how about these new/enhanced functions? I'm keen to find a use for each!

DOSUBL
In essence, the DOSUBL function allows macro code to be executed in the middle of a DATA step. This almost turns the order of SAS execution on its head!

FCOPY
The FCOPY function makes file copying simpler. FCOPY reads a record from one fileref and writes it to a second.

PUTN/PUTC
These old favourites have been enhanced with the ability to override the justification of your output. You can centre, right-align, or left-align the output you create.

Friday, 12 July 2013

NOTE: SAS9.4 Documentation Now Available

It's good to see the appearance of the SAS 9.4 documentation publicly in the last day or so. I shall be scouring it over the weekend!

SAS 9.4 undoubtedly provides new capabilities for programmers and data analysts, but it also promises simplified and broader administration capabilities - some of which benefit users as well as administrators by offering enhanced availability.

One of the most intriguing aspects of 9.4 for advanced programmers will surely be the formal introduction of DS2. I focused a number of items on DS2 earlier in the year and it holds a lot of promise for improved performance.

For administrators (and users), the high-availability metadata server is well worth investigation.

Monday, 1 July 2013

News Reading - Post Google Reader

Today is a sad day. As of today, Google Reader is no more. I've previously mentioned how much I use Google Reader to keep tabs on news around the internet, and I've encouraged readership of NOTE: via Google Reader or other similar tools.

The demise of Google Reader was announced back in March, alongside a raft of other retirements. Since that time, a number of news readers have been working overtime to capture the departing Googlers, no least Feedly. It's no small task because Google have removed the back-end aggregation of news articles, not just their front-end client.

To ensure a smooth transition, Google provided a three-month sunset period so that all users had sufficient time to find an alternative feed-reading solution. Anybody wanting to retain their Reader data, including subscriptions, was able to do so through Google Takeout.

Feedly have done a great job of building their own back-end, and they offered an automated migration from Google Reader, so one didn't even need to use Google Takeout. Feedly have generously made their back-end available to their competitor's clients too. The details are at http://cloud.feedly.com. You can start your use of Feedly, and you can see a list of supported clients.

The Feedly client is available as a variety of mobile apps, plus through your browser. I've been happily using it on my Android devices for some weeks and switched to the Feedly cloud a couple of weeks back.

I still think that the best means of keeping up-to-date with news is through an RSS reader. It's like my personal newspaper with news from the variety of blogs and web sites that I subscribe to giving my news about technology, motor racing, food & drink, and all my other hobbies and interests.

NOTE: has 500 subscribers who get new articles pushed to their reader, but we also have 2,000 Twitter subscribers, so the observation about the demise of Google Reader being due to the different way that people consume news (frequently via social media) possibly holds true. Regardless, we intend to support as many means of accessing NOTE: for as long as possible.

Monday, 24 June 2013

NOTE: Agile Developments at SAS

Seek and you shall find. Isn't Google wonderful? I'm a keen proponent of Agile software development practices and processes. I've long been curious to know more about the software development processes used within the various teams at SAS. Jason Burke wrote an informative blog post back in 2009 but I just hit upon a recent paper by SAS's Tim Arthur titled Agile Adoption: Measuring its worth.

The paper was prepared for the April 2013 Strategic Execution Conference and it describes the results of Tim's survey on Agile adoption within SAS since the initiation of some pilots in 2007. Tim describes how Agile has been interpreted and adopted at SAS, and then presents his survey findings. The survey found that respondents' believed that their teams had produced higher quality products since they started adopting Agile practices, and respondents would recommend Agile techniques to other teams.

The paper places greater emphasis on the survey and its results rather than the Agile practices and processes adopted within SAS but nonetheless I found it a most interesting read.

Accompanying slides (and the paper) can be found here: http://support.sas.com/rnd/papers/2013/AgileAdoption.zip.

[UPDATE. Coincidence? Tim Arthur just posted a blog entry about Agile on the SAS blog site today. It's titled How SAS R&D does agile and it briefly talks about the use of Agile at SAS]

Monday, 17 June 2013

NOTE: Describe Your Table in SAS to Write the SQL Code

A week or so back I highlighted two best paper winners from this year's SAS Global Forum - Steve Overton and John Heaton - and I then subsequently highlighted one of John's papers. I thought I should do the same for Steve, but then I saw a blog post from Steve of such wonderful simplicity that I thought I'd highlight the blog post instead. For those familiar with the SQL DESCRIBE statement you'll know that it not only "describes" a table but it does so by offering code to recreate the table.

In Describe Your Table in SAS to Write the SQL Code, Steve describes how to use SQL DESCRIBE to generate executable code to (re)create a table. As Steve says, this is a useful reverse-engineering technique for generating empty tables as a step in establishing your data warehouse or data mart. It's one of those things that seems to have no purpose until you need to do it!

I've seen experienced SAS coders writing reams of DATA step code to reverse-engineer a data set. SQL DESCRIBE does it for you nice and easy!

Tuesday, 11 June 2013

NOTE: Animated Graphics, Courtesy of V9.4 SAS/GRAPH

There's so much of interest in Rob Allison's recent SAS Training Post blog article Create animations like Hans Rosling! that I don't know where to start!

Rob's reference relates to the subject of a 2010 post from me (originally highlighted by a tweet from Chris Hemedinger) in which Herr Rosling shows his own work in some superb graphics, aided by the BBC.

Rob's re-production of the animated graphics is achieved through use of some v9.4 SAS/GRAPH features. Independently, Rob has documented a vast array of v9.4 SAS/GRAPH features on his web site.

At first sight, this kind of work might appear to be more art than science, more infographic than statistical chart, but it does a very effective job of getting its analytical point across. And it neatly brings us back to last month's post on infographics, spurred by a different post from Rob!

NOTE: Release Management and Version Control

Yesterday I mentioned SAS platform administrators and how their work and their value can be overlooked. My post related to an article on the SAS Users Groups blog. Last week I saw another SAS Users Groups blog entry about something else that is often overlooked: Release Management.

The blog post was a nod to the best contributed paper in the Systems Administration and Architecture stream: SAS Release Management and Version Control by John Heaton (also winner of best contributed paper in the Data Management stream as I mentioned on Friday).

At the risk of turning this week's sequence of blogs into a celebration of all-things-overlooked, I thought it worth highlighting John's paper because management of releases and versioning does indeed tend to get lost in the excitement and frenzied activity associated with application upgrades. Steve O'Donoghue and I were invited to present a related paper at SAS Global Forum 2009 entitled Configuration Management for SAS Software Projects so it's clear that the topic is one in which I hold a special interest.

John describes release management as "the process of managing multiple different software releases between environments in a controlled, auditable and repeatable process" and his paper looks at the capabilities of the SAS 9.3 toolset to build an effective Release Management process to support the migration and maintenance of SAS code throughout the software development lifecycle (SDLC).

John makes specific references to Subversion (SVN) as a tool for storing current and previous versions of code. SAS tools don't explicitly support SVN (or any of its competitors) so John describes his approach to marrying SAS and SVN.

Having made introductions to SVN, John continues by covering import and export of metadata-resident objects such as DI Studio jobs. DI Studio is the focus of John's paper. He doesn't forget to include an approach for deploying unplanned software patches.

John's paper is very technical in nature, but be sure to understand the over-riding strategies that are implicit in what he says. Ignoring or overlooking release and version control is perilous. If you're working in a regulated industry then your regulators are likely to suggest that you are not in control of your software development process. Without clear, robust release and version control you risk expensive mistakes during or after software upgrades.

Monday, 10 June 2013

NOTE: SAS Platform Administration - Information Sources

SAS platform administrators are the unsung heroes of many SAS sites. Most SAS users have no conception of the range and complexity of technology that sits below the user-facing SAS interfaces like Enterprise Guide, Web Report Studio and Visual Analytics. In SAS administrator connections and resources on the SAS Users Groups blog a few weeks ago, Christina Harvey presented a nicely structured index of useful web content. If you are a SAS administrator, Christina's list is well worth a visit.

Christina categorised her recommendations as follows:
  • Connecting with other SAS administrators (I was honoured to see the NOTE: blog included in this list)

  • Support.sas.com sites for installing and maintaining a SAS installation

  • Videos for the SAS administrator

  • Training and documentation
Truly, an excellent meta-resource for SAS administrators.

Humour supplied by The IT Crowd. British humour; technology humour. Available on Netflix UK, etc.


Friday, 7 June 2013

NOTE: Best Contributed Paper Awards from SAS Global Forum 2013 #sasgf13

I continue to be foxed by the lack of a Closing Session at this year's SAS Global Forum (SGF) in San Francisco. One of the highlights of each Closing Session at previous conferences was the presentation of Best Contributed Paper awards for each stream of the conference. Recognition for those who have provided the "show" has always seemed important to me. Contrary to popular opinion, presenters who contribute papers pay the full conference fees; they get no discount.

I saw no announcement and heard no drumroll, but I see that the best paper award winners have at last been listed on the SGF 2013 web site.

I offer my congratulations to all 15 winners. A couple of winners deserve special mention:
  • Steve Overton won best BI paper this year and has won it consistently for several years previously

  • John Heaton won two awards - Data Management, and Systems Architecture & Administration
Let's hope the Closing Session returns in 2014.

Best Contributed Papers 2013
Best Contributed Papers 2012
Best Contributed Papers 2011
Best Contributed Papers 2010

NOTE: Reporting Horizontally (WRS tabs)

I recently spotted a neat tip from Tricia Aanderud on the BI Notes blog. In the article Web Report Studio: Switch Report Sections to Tabs in Snap! Tricia provides us all with a reminder of the ability to create tabs in our Web Report Studio reports and thus save our users from having to scroll down and down and down a report to find the table or chart that they're interested in.

Whilst the content (and quality thereof) of our reports is the most important aspect of our reports, the presentation and accessibility often comes a close second. If your reports are not attractive and easy to navigate and use then your content won't be seen.

Wednesday, 29 May 2013

NOTE: The Dawn of 9.4 Approaches

There were many papers at SAS Global Forum 2013 on the upcoming 9.4 version of SAS. You can find many of them here. I recently saw a blog post from Robby Powell with a good summary of what to expect from 9.4. It's worth a look to see what will be available next month when 9.4 is released.

I already know of one major site in the UK that is planning to quickly upgrade to 9.4 to get the significant benefits of its clustered metadata servers (providing much-increased resilience). What are your plans?

Tuesday, 28 May 2013

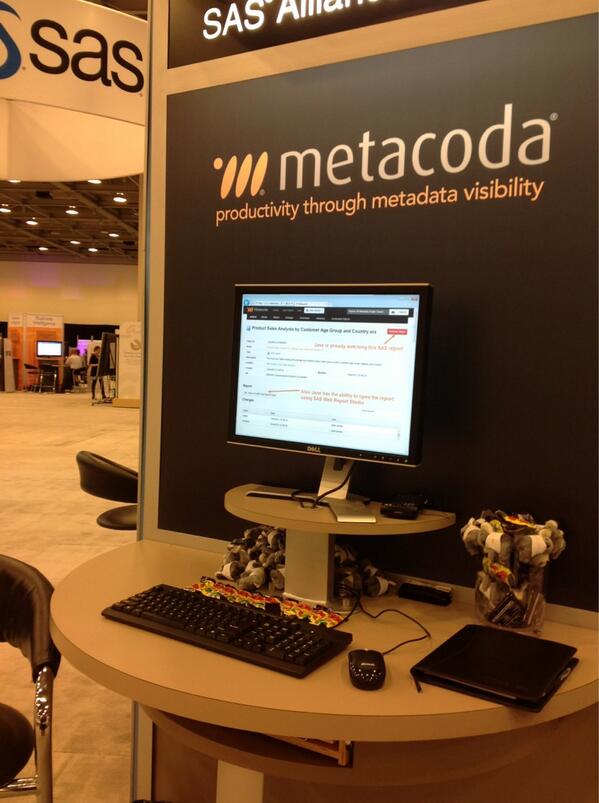
NOTE: Adding Value to Your Metadata with Metacoda Commutual

I'm always glad to meet-up with the folks from Metacoda when I attend SAS Global Forum. They always have something new and valuable to show. Historically it's always been new features for their Metacoda Security Plug-Ins, but this year they were keen to talk about Metacoda Commutual.

The Metacoda Security Plug-Ins are add-ons for SAS Management Console which improve the productivity of administrators working on SAS metadata security. They provide clearer views of your security ACTs and ACEs together with the access that your security rules are giving to groups, roles and users. Over the years, the Plug-Ins have grown into a powerful and valuable tool.

First mentioned on this blog back in November last year, Metacoda Commutual is a web application for searching and collaborating around business and technical metadata in SAS, including discussions and notification of changes to items of interest. As I said in November, "I think the idea has great merit. Metadata is not just a technical thing; it represents the objects that are important to our business."

The Metacoda web site has a lot more information on Commutual, here’s a quick summary of the main focus areas of the new product:
  • Activity: get notified about any changes and discussions on items of interest to you

  • Search: find the items you want and register your interest in seeing activity for them

  • Discussions: share your knowledge and learn from the knowledge and experience of others

  • Easy Access: get easy access from anywhere: browsers on desktop PCs, tablets, or smart phones, and even custom applications, add-ons, and plug-ins

  • Performance: to make it as fast as we can, so you can find what you need, when you want it, and don’t miss out on shared knowledge because it takes too long or it’s too hard to find

  • Security: only provide access to metadata you normally have access to
Metadata is not just a means to an end from a technical perspective. Your BI reports and DI jobs are important to you and your business; recording and sharing extra information about these objects is of great value. I think Commutual has great value. What do you think?

[UPDATE. Metacoda have posted a video demonstration of Commutual, so you can see it in action]

Wednesday, 22 May 2013

Recent Writing (Infomous)

I recently added a new widget to the right margin of the NOTE: blog - "Recent Topics". It's a form of word cloud, but it's far more dynamic and interactive than a traditional word cloud. Hover over a word (or click on it) to see a list of NOTE: articles featuring the specified word; click Drill-Down to get a sub-cloud of associated words.

If you don't subscribe to NOTE: (through RSS or email) then it can be especially difficult to make the best use of the blog's content. The new widget shows words from the most recent 25 NOTE: posts and I think it will be of benefit for catching-up on recent content that is of interest to you.

The word cloud is supplied by Infomous. Hover your mouse near the bottom of the diagram for a menu of options. From the Infomous FAQ:
  • The size of each word reflects the frequency with which it appears in the source

  • If you click on a word, a drop down list appears with links to articles that are related to the specific word. The drop-down will also appear if your mouse lingers over a word. By clicking on a link in the list, you will navigate to that specific article

  • Topics become linked when they are mentioned in the same context or discussed together multiple times. Related terms and concepts are linked together with lines so you can grasp the context of any relevant topic

  • The words in the Infomous cloud are organized in groups of related words. This provides you with a quick glimpse of which topics belong together in conceptual clusters
Plus, it looks cool, and it's fun. Try it, and drop me a comment!

Tuesday, 21 May 2013

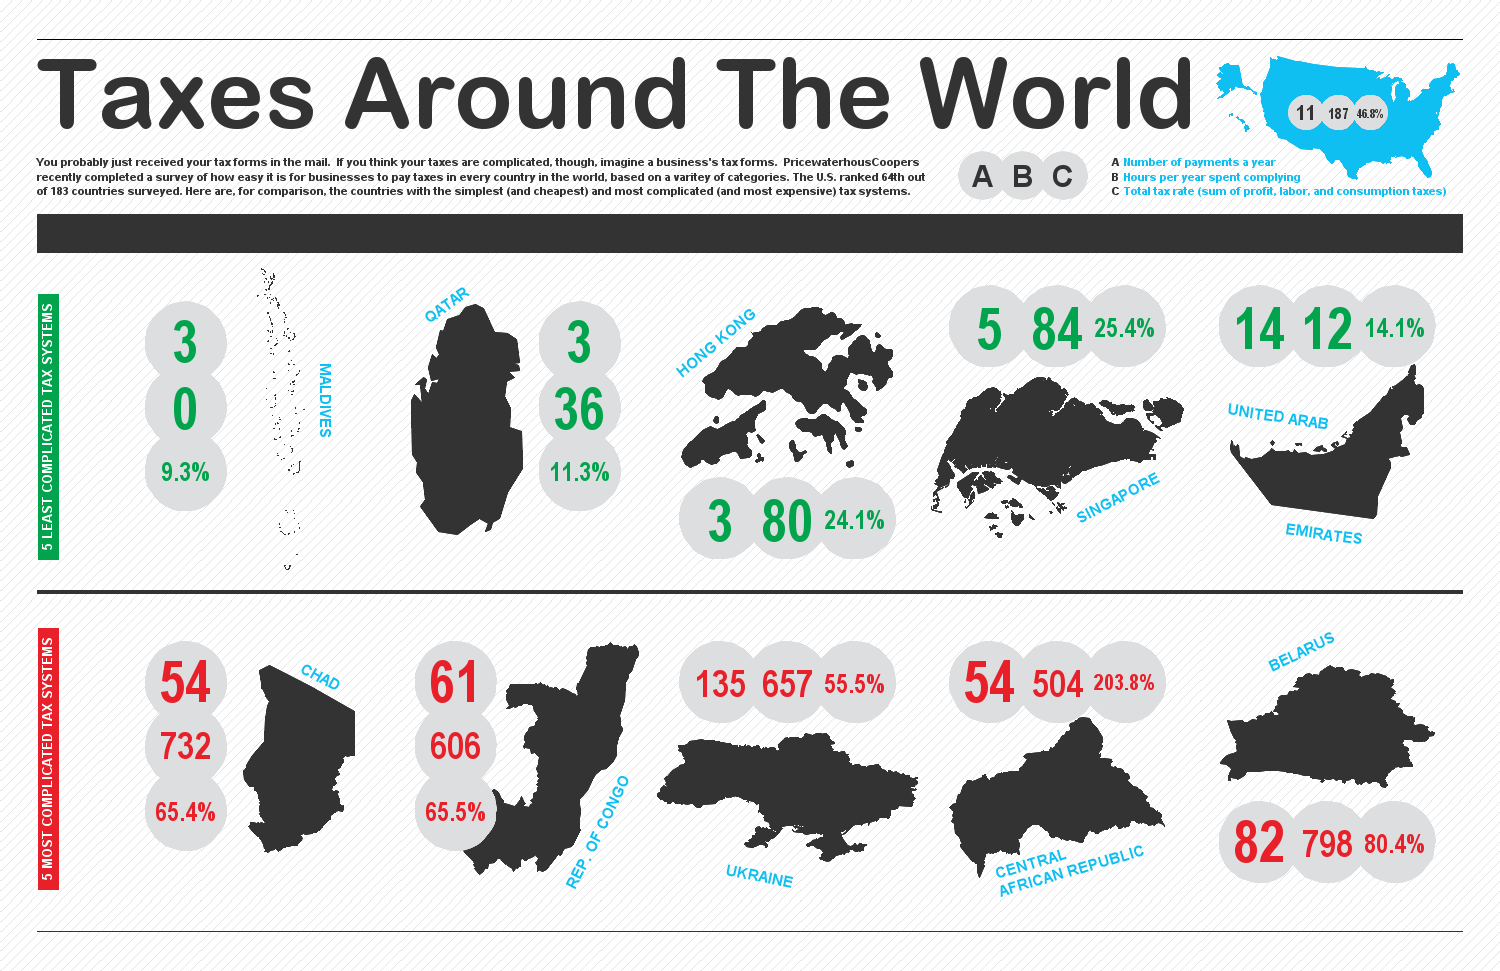
NOTE: Infographics with SAS

I saw a nice post by Rob Allison last month on creating infographics with SAS. Whilst we mostly endeavour to create hi-fidelity graphics in SAS that show a relatively high volume of detailed graphical information, there are a wide variety of uses for graphical presentation. Infographics should not be overlooked.

As Rob says in his post, there's no firm definition of the term "infographic", but I think Rob's description sums it up nicely: something half way between data visualisation & artwork. SAS graphics are typically created straight from the data - rightly so - but infographics then apply some analysis and some presentational elements in order to enrich the result.

In his post, and links to his site, Rob describes how he created the half dozen samples that Rob includes in the post.

Whilst there's no specific mention of infographics, there is rich store of information about creating SAS graphics in this year's SAS Global Forum proceedings. See the Reporting and Information Visualisation stream, and the Posters stream.

To experiment with infographics and try ideas and styles, there are some useful online resources such as Infogr.am which allow you to create infographics with a set of tools intended specifically for creating infographics.

It's important to produce accurate graphics, but making them attractive and approachable will mean more people get to see the fruits of your labours. And if you're in the right position to apply some interpretation to the material then so much the better. And it can be fun letting your artistic side have a little space to express itself!

Wednesday, 15 May 2013

Affinity Diagrams for Problem Solving #sasgf13

I was pleased to be invited to present a paper on Visual Techniques for Problem Solving and Debugging at this year's SAS Global Forum (SGF) conference. I spoke about the importance of human interaction in solving complex issues; the process and people make a far greater contribution than the associated software tools. I spoke about seven more-or-less visual techniques, some of which I've highlighted in NOTE: before:
DMAIC is an excellent end-to-end process to give structure to your whole problem solving endeavour. 5 Whys is a flexible technique for probing root causes. Ishikawa is a terrific approach to information gathering and helps ensure comprehensive coverage of the problem area.
The Ishikawa diagram (and most of the other techniques I discussed) is a top-down approach. The distinctive element of the Affinity diagram is that it is created bottom-up. Whilst the Ishikawa (and Mind Map) are drawn by starting with general topics (or questions) and then drilling down into detail, the process of drawing an Affinity diagram begins with a brainstormed set of detailed observations and facts.

The bottom-up idea can sound unstructured, but is it ever a bad thing to have too many ideas? Probably not, but if you've ever experienced information overload or struggled to know where to begin with a wealth of data you've been given, you may have wondered how you can use all of these ideas effectively.

When there's lots of "stuff" coming at you, it is hard to sort through everything and organise the information in a way that makes sense and helps you make decisions. Whether you're brainstorming ideas, trying to solve a problem or analysing a situation, when you are dealing with lots of information from a variety of sources, you can end up spending a huge amount of time trying to assimilate all the little bits and pieces. Rather than letting the disjointed information get the better of you, you can use an Affinity diagram to help you organise it.

Also called the KJ method, after its developer Kawakita Jiro (a Japanese anthropologist) an Affinity diagram helps to organise large amounts of data by finding relationships between ideas. The information is then gradually structured from the bottom up into meaningful groups. From there you can clearly "see" what you have, and then begin your analysis or come to a decision.

Here’s how it works:
  1. Make sure you have a good definition of your problem (ref: DMAIC)
  2. Use a brainstorm exercise (or similar) to generate ideas, writing each on a sticky note. Remember that it’s a brainstorm session, so don’t restrict the number of ideas/notes, don’t be judgemental, don’t be afraid to re-use and enhance ideas on existing sticky notes, and don’t try to start solving the problem (yet)
  3. Now that you have a wall full of sticky notes, sort the ideas into themes. Look for similar or connected ideas. This is similar to the Ishikawa’s ribs, but we’re working bottom-up, and we’re not constrained a by a set of ribs as our start points. When you’re doing this, it may help to split everybody into smaller teams
  4. Aim for complete agreement amongst all attendees. Discuss each other’s opinions and move the sticky notes around until agreement is reached. You may find some ideas that are completely unrelated to all other ideas; in which case, you can put them into an “Unrelated” group
  5. Now create a sticky note for each theme and then super-themes, etc. until you've reached the highest meaningful level of categorisation. Arrange the sticky notes to reflect the hierarchical structure of the (super)themes
You’re now in a similar position to where you would be with an Ishikawa diagram and can proceed accordingly. The benefit of the Affinity diagram over Ishikawa is that the bottom-up approach can produce different results and thereby offer different perspectives on your problem.

Affinity diagrams are great tools for assimilating and understanding large amounts of information. When you work through the process of creating relationships and working backward from detailed information to broad themes, you get an insight you would not otherwise find. The next time you are confronting a large amount of information or number of ideas and you feel overwhelmed at first glance, use the Affinity diagram approach to discover all the hidden linkages. When you cannot see the forest for the trees, an Affinity diagram may be exactly what you need to get back in focus.

If you'd like to know more about some of the other techniques, you can catch an audiovisual recording of my whole paper on Brainshark.

Tuesday, 14 May 2013

Predictive Analytics in the 17th Century

I recently stumbled across the work of John Graunt, a London resident in the mid 17th century. Graunt used London's Bills of Mortality to publish an insight into the causes and spread of the plague. Among other things, he was able to use the data to prove that plague was not spread by person-to-person contact, and peaks of plague were not related to the reign of a new king. He found that more boys were born than girls but that infant mortality equalised the ratio. Most importantly, he found that by analysing data you actually uncover knowledge.

From humble beginnings as a haberdasher, he rose to the respect of King Charles II and was elected a member of the Royal Society. Graunt was a self-educated man, yet the statistical, epidemiological and demographic work evidenced in his Observations set him out as a pioneer. 350 years ago, Graunt was doing what we might now call "public health intelligence". Graunt calculated that 36% of children didn't reach the age 6 (a startling figure by today's standards). With further categorisation and analysis, he deduced that people were dying of causes unrelated to age - preventable diseases.

Graunt's 17C London
Graunt's work helped to encourage medical practitioners of the day from merely treating symptoms to investigating preventative measures. There are strong similarities with the evolution of business intelligence techniques (from reporting on history, to predicting the future, to influencing the future).

Despite Graunt's successes with the analysis of the data, routine collection and analysis of health data didn't start until 200 years later (William Farr was appointed as the 1st compiler of scientific abstracts). Nonetheless, we should acknowledge his achievements and his pioneering of "analytics".

Further reading:

Excerpt from The Lancet, 1996:
http://www.epidemiology.ch/history/PDF%20bg/Rothman%20KJ%20lessons%20from%20john%20graunt.pdf

Ed Stephan's collection:
http://www.edstephan.org/Graunt/graunt.html

StatProbe Encyclopedia:
http://statprob.com/encyclopedia/JohnGRAUNT.html

Thursday, 9 May 2013

NOTE: Metadata-Bound Libraries - Updates at SGF 2013 #sasgf13

Back in November last year I mentioned Metadata-Bound Libraries. This v9.3 M2 (and above) functionality allows you to force access to your data through metadata libraries, thereby enforcing your metadata security plans.

One of the nuggets of information I learned at SAS Global Forum 2013 was that v9.4 will introduce menus in SAS Management Console to ease the effort of building PROC AUTHLIB code. Plus, the process of unbinding data sets from the metadata libraries will be made easier and simpler. Currently, one has to copy the data sets to an unbound library; v9.4 will allow unbinding to be performed in-place.

In a future release, administrators will optionally be able to make encryption compulsory for all data sets and libraries; and support for AES encryption will be provided. Finally, the metadata server will be able to store the encryption key and send it (encrypted) when required. This will remove the current need to hard-code keys into batch code (and thereby remove the security weakness).

NOTE: SAS Global Forum 2014 #sasgf14

No sooner has SAS Global Forum 2013 finished than we get to see the 2014 web site. Next year's conference is in Washington, D.C. between March 23rd and 26th.

I hear there are some changes afoot in the organisation of the conference.  Along with the absence of a Closing Session at this year's conference, there was no announcement of section chairs for the streams of papers in next year's conference. The web site offers no further information on section chairs, but it does tell us that the Call For Content opens in July. This appears to be different to previous years' Call For Papers, and it's much earlier in the year too. All-in-all, I'm intrigued to see what the plan is.

I clearly need to get my skates on and do more than just think about next year's papers over the next few months.

Wednesday, 8 May 2013

Improve Your Mobile Typing (KALQ)

I didn't see this paper presented at SAS Global Forum(!) even though there's plenty of pattern matching and analytics involved in the project, but maybe I'd have benefited from having the associated software installed on my Android tablet whilst writing notes and blog posts.

It's (yet another) alternative keyboard for mobile (phone and tablet) devices. It dares to diverge from QWERTY, and it's thumb-focused, i.e. it doesn't expect you to be a Mavis Beacon alumni. Thus, the researchers claim "it will take about 8 hours of practice to reach the typing rate that is comparable to that of a regular Qwerty keyboard on the same device. Practice beyond that point will improve the rate further". However, it promises much because the layout has the following properties:
  • The division of work is almost equal, at 54% and 46% for the right and left thumb, respectively.
  • Alternation is rapid: 62% of the taps are switches.
  • Travel distances are short: On average, the left thumb moves 86 px, the right 117.
  • The space bar is centrally located.
  • The right thumb handles all vowels except y. The clustering of vowels around the space bar favours quick switches and minimises travel distance. The right thumb is responsible for 64% of same-side taps.
  • The left thumb has most of the consonants, exploiting its ability to hover above the next button sooner. It has most first letters of words and most of the consonants.

I'll confess. I bought a Nexus 7 in San Francisco, sitting alongside my Galaxy Nexus phone and my Asus TF101 tablet/laptop. Yes, I'm an Android fan. But, in my defence, the battery on my Asus had run dry and I'd brought the wrong recharging kit, so what was I to do!

I saw a lot of people at SGF writing notes on tablets and phones, so KALQ has a large target market. I'm going to try it on my Nexus 7. I'll let you know if it's a success.

NOTE: High-Availability Metadata #sasgf13

One of the most notable features of v9.4 wasn't mentioned in the SAS Global Forum Technology Connection but I caught a paper by Bryan Wolfe on the subject. SAS v9.4 will remove SAS's most notable "single point of failure" - the metadata server. SAS architects and administrators will optionally be able to specify and create a cluster of metadata servers (with real-time shared data) to mitigate metadata server failure.

For those with SAS systems providing high value operational services, this enhancement could be a key deciding factor in choosing to upgrade to v9.4. Sites with less demanding applications can choose to retain a single metadata server.

Whilst SAS has hitherto offered a large degree of resilience for failure of most processes and servers (particularly with the use of Grid and EGO), the metadata server has always been a weak link. V9.4 resolves this shortcoming by introducing the ability to cluster a group of metadata servers, all of whom are running 24x7, communicating with each other, and able to take-over the work of a failed metadata server.

The coordinated cluster of metadata servers appears as a normal metadata server to SAS users. Hence, no code changes will be required if your site implements this technology. The chosen approach is intrinsically scalable.

The cluster requires three or more nodes; each is a full metadata server. One is nominally a master, the others are slaves. The system decides who is the master at any point in time. Each metadata server must have access to a shared backup disk area.

Client connections go to slaves. Load balancing causes redirects when required. The load balancing means that read performance is the same or better when compared with v9.3 performance. To keep all metadata server instances synchronised, slaves pass write requests to the master, and the master then passes those requests asynchronously to all other slaves so that they can update their own copy of the metadata storage (in-memory and on disk).

SAS clients (such as Enterprise Guide and Data Integration Studio) keep a list of all nodes. Each client is responsible for reconnection. This is transparent to users. Hence, in the event of a slave failure, the client will automatically establish communication with an alternate server. If the master fails, the remaining slaves need to negitiate with each other to "elect" a new master. As a result, there can be a more noticeable delay, although it's unlikely to exceed 10 seconds.

The new functionality will be supported in v9.4 on all SAS platforms except IBM Z/OS. All metadata servers must be on the same OS. The cluster license is included in SAS Integration Technologies. Unlike some of SAS's other high availability and failover solutions, no additional 3rd party software is required.

All-in-all, this is a very significant enhancement for those who rely on their SAS systems to reliably deliver information, knowledge and decisions.