Pages

Wednesday, 28 November 2012

NOTE: Metadata-Bound Libraries

Since the introduction of metadata-defined LIBNAMEs in the earliest days of version 9, it's been a frustration that the security that can be applied within SAS metadata to control who can access libraries can be completely undermined by users simply hand-coding an equivalent LIBNAME statement with a specific path to the data and thereby bypassing the SAS metadata security layer. It seems that V9.3 M2 introduced a solution to this, but it competely slipped under my radar - until now (my thanks to BS for alerting me to this).

The new SAS 9.3 Guide to Metadata-Bound Libraries tells us how data sets and views within metadata-bound libraries can only be accessed via the metadata-defined LIBNAME. The data sets are created with a special flag in their internal metadata which specifies their nature. Thus, access from SAS to data within a metadata-bound library is provided only if all of the following conditions are met:
  • The requesting user can connect to the metadata server in which the corresponding object is stored
  • The requesting user’s metadata identity has all required metadata-layer effective permissions for the requested action
  • The host identity with which the data is retrieved has all required host-layer access to the data.
In my view, this is a very significnt enhancement to the security of SAS data. SAS metadata has long provided powerful and flexible capabilities for protecting your data, but it has always been possible to completely bypass it and leave the OS-level security as the gatekeeper. Applying passwords to data has never been a great solution because of the weak encryption and the need to hard-code the passwords in SAS code.

The security provided by metadata-bound libraries is strong, even surviving when the physical table is recreated or replaced. The cornerstone of this approach is the fact that the physical table contains the flag to specify it's a metadata-bound table, so all elements of SAS are available to respect the need to check the access permissions via metadata.

Inevitably, it's not a panacea. For instance, you can only bind BASE SAS data sets and views, and you cannot bind concatenated libraries; and though the binding prevents unauthorised access from SAS, it does not prevent non-SAS access to the data (non-SAS access is limited only by the OS-level security), so it is still possible to delete or rename tables without authorisation via SAS metadata.

All of this is made possible by the new PROC AUTHLIB (there's no GUI interface for creating metadata-bound libraries yet). AUTHLIB's CREATE statement allows you to create the binding.

This is a hugely significant step forward for SAS security, and a major benefit to be derived for anybody considering an upgrade from any version of SAS prior to V9.3 M". And do note: It's the second maintenance release of V9.3; metadata-bound libraries are not available in earleir versions of V9.3.

NOTE: ODBC Performance

SAS is great at getting data from a huge variety of sources. With its SAS/ACCESS connectors, SAS can get data from these sources in an optimised fashion, i.e. using the native capabilities of the source data provider. In these days of increasingly large set of data, optimisation and efficiency are crucial factors. Steve Overton wrote an article in the Business Intelligence Notes blog earleir this month in which he offered some experience and advice with regard to gatrhering data into SAS via ODBC.

ODBC is a generic means of accessing a large variety of different data sources. As such, it's less easy to optimise the process, but nonetheless we want the data to flow at the best possible rate. In SAS Administration: Fetch Big Data Faster Across ODBC, Steve describes how judicious use of the FETCH and USEDECLAREFETCH parameters in the ODBC.INI file can make big differences to the speed of your data access. Valuable.

Monday, 26 November 2012

NOTE: Documenting Your SAS Environment

If you're a new starter, or somebody just gave you extra SAS administration responsibilities, you may be struggling to find your way around the new SAS environment. Brian Varney presented an insightful paper at this year's South East SAS Users Group (SESUG) entitled Getting to Know an Undocumented SAS Environment. Brian's insights will be of use to those pitched into the situations I described above.

Brian structured his paper into what, where, and who. In each section, Brian presented brief tips and techniques for discovering details about the SAS environment.

How do I know Brian presented this paper? Did I visit Durham in North Carolina and attend SESUG? Sadly, no. But I do subscribe to SAS's SAS Users Groups blog. It reduces the jet lag! Christina Harvey's How to Document Your SAS Environment article alerted me to Brian's paper. If you're in need of a better understanding of your SAS environment, I recommend you check it out.

AND, it's clearly a popular topic because David Chapman was talking on the same topic at NESUG (NorthEast SAS Users Group). In Determining What SAS Version and Components Are Available (MA01) (highlighted on the SAS Users Blog, again), David discussed a macro that he had written to display salient information. I was most interested to follow his reference to SAS Knowledge Base article KB20390 which offers some very neat code (with very neat output, more to the point) for displaying what server software you're licensed for, what you have installed, version numbers and a bunch of other stuff.

NOTE: Getting Social With SAS Metadata

I noticed a most intriguing post on Paul Homes's Platform Admin blog recently. Do you and your colleagues discuss your metadata often? Paul thinks you should, and I'm inclined to agree.

This isn't a new or unique idea. SAS were talking about a collaboration framework at this year's SAS Global Forum, and I wrote a brief post about it. The idea of having a platform to facilitate business-like discussions that are focused upon specific business objects such as web reports, information maps, tables, stored processes and cubes seems to hold value.

You'll recall that Paul runs Metacoda Pty Ltd, providers of SAS services plus the excellent Metacoda Security Plug-Ins for viewing your SAS security metadata and rules. Well, Metacoda are now in the final stages of development of a new product to facilitate discovery and discussion of your metadata.

Fundamentally, the Metacoda product (which doesn't seem to have a name yet) will provide:
  • Activity: get notified about any changes and discussions on items of interest to you
  • Search: find the items you want and register your interest in seeing activity for them
  • Discussions: share your knowledge and learn from the knowledge and experience of others
  • Easy Access: get easy access from anywhere: browsers on desktop PC’s, tablets, or smart phones, and even custom applications, add-ons, and plug-ins
  • Performance: to make it as fast as we can, so you can find what you need, when you want it, and don’t miss out on shared knowledge because it takes too long or it’s too hard to find
  • Security: only provide access to metadata you normally have access to
I think the idea has great merit. Metadata is not just a technical thing; it represents the objects that are important to our business. Paul is seeking collaboration with enterprises who might be able to make immediate use of Metacoda's new tool. If your interest is piqued, get in touch with Paul via the link at the bottom of his post.

Wednesday, 21 November 2012

NOTE: Now I see Visual Analytics

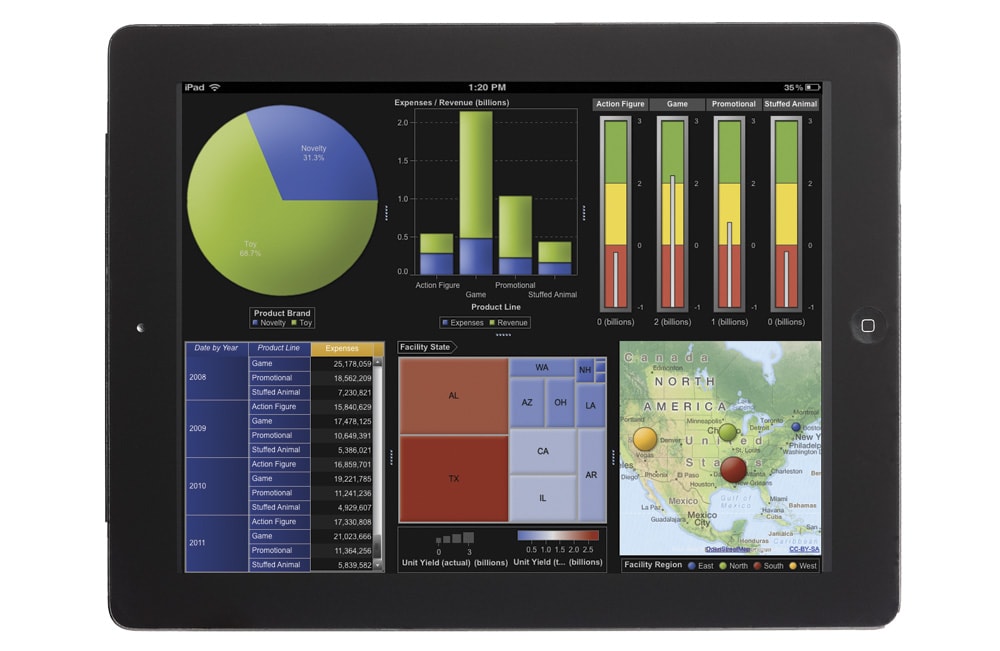
I'll confess that whilst there was a lot said about SAS Visual Analytics at this year's SAS Global Forum, I came home with some confusion over its architecture, functionality and benefits. I was fortunate to spend some quality time with the software recently and I think I've now got a good handle on it. And it's impressive.

It's comparatively early days in its life cycle; it provides value for a significant set of customers, but it will benefit an ever larger population as it evolves and gets enhanced over time.

The key benefits as I see them are i) its handling of "big data", ii) its user friendly yet highly functional user interface, and iii) its ability to design a report once yet deliver the report through a variety of channels (including desktop, web and mobile).

The big data element is delivered through in-memory techniques that are incorporated in the SAS LASR Analytic Server. In essence, this means that you need to reserve a number of servers (on commodity "blade" hardware or on database appliances from EMC Greenplum and Teradata) for the purpose of providing the in-memory capabilities. Once the data is loaded onto the LASR server and copied into memory, users can explore all data, execute analytic correlations on billions of rows of data in just minutes or seconds, and visually present results. This helps quickly identify patterns, trends and relationships in data that were not evident before. There's no need to analyse sub-sets of your data and hope that they are representative of the full set of data.

The user-friendly interface is largely drag-and-drop in a similar style to the design of Excel pivot tables. There is a wide range of output styles such as tables, graphs, & charts, and these can be laid-out into a report and linked together for synchronised filtering, drilling, slicing and dicing. The current release incorporates regression analysis and correlations. I anticipate that future releases will soon after more functionality such as forecasting.

The reports that you design in Visual Analytics are simultaneously available through a number of channels including web, and  mobile on iPad & Android. This means that your dashboards and reports are available to anybody, anywhere (combined with SAS security measures that make sure nobody sees any information that they are not meant to).

All-in-all, SAS Visual Analytics is another step in taking away the friction caused by technology limitations and allowing analysts to execute their analytical processes more effectively and efficiently. Less programming, more analysis, better results.

Monday, 19 November 2012

NOTE: Clean Your Cubes

It's not spring-time, but it's still worth giving a thought to the cleanliness of your environment, for the benefit of reducing complexity and of reducing space usage. Angela Hall posted a great article about Cleaner OLAP Cube Physical Folder Structures earlier this month on SAS's Real BI for Real Users blog.

In her article, Angela gave a "below the water line" view of OLAP cubes and how they are maintained and stored. Her tips for cube rationalisation will reduce disk space usage and improve performance. Well worth a look.

Coding For All - Competition for the Family

There's a debate in the UK, and many other countries around the globe, regarding the content of the IT curriculum (or, ICT as it's known in the UK). Speaking from experience, my kids have been taught how to use Microsoft Office products, but they haven't been taught programming in any of its guises. I've bemoaned this in the past, and I continue to do so.

There is an increasing number of fun ways to learn programming and computer science. The Raspberry Pi device is one good example. Another, not mentioned in these pages before, is the App Inventor for Android. You don't need an Android phone to use this Google-initiated tool to develop real-life apps for Android phones. I showed this to my daughter and she was instantly inspired to create a One Direction soundboard app and share it with her Android-toting friends. Result!

As I say, you don't need an Android device to use App Inventor. That's because it has a built-in phone emulator that you can run on your PC. The emulator is a precise emulation of an Android phone, so you have to wait for Android to load on the phone and then swipe horizontally to unlock it.

The concept of App Inventor is to permit the creation of programs by visual means - designing the screen, then creating the program by slotting together a wide variety of jigsaw-like programming constructs. It sounds limited but it's not.

App Inventor started life as a Google experimental lab project in 2010 but it was halted at the end of 2011. Massachusetts Institute of Technology (MIT) took over the support of the project and it's now known as MIT App Inventor. It has a few rough edges, but it's worth persevering through those small problems because the ability for kids to create mobile phone apps is inspirational. Not only is my daughter hooked but those to whom I've recommended it now have their own kids hooked on producing increasingly complex and functional apps too.

And what better way to promote something than with a competition. That's just what MIT have done. With four different age categories (including an open age category for adults), and a first prize of a Nexus 7 Android tablet in each category, there are many good reasons to get the app of your kids chosen as "most outstanding". The competition closes December 12th so you have a good number of weeks in which you or your kids can i) think of a great app idea, and ii) get familiar with App Inventor and get coding.

To get started with App Inventor, go to the site, click Explore, go to the Learn tab and follow the tutorials. In the Setup tutorial, make sure you install the App Inventor software on your PC. However, to enter the competition you'll need to join the App Inventor Community Gallery (The Gallery is in Beta, go to The Gallery to request full access).

There is some excellent learning material on the App Inventor web site, but you can also find a lot of fabulous information at Professor David Wolber's site. Prof Wolber teaches computer science at the University of San Francisco (spooky, San Francisco again!) and uses App Inventor in his courses - and he wrote the App Inventor - Create Your Own Android Apps book.

Enjoy yourself. Good luck!

Wednesday, 14 November 2012

NOTE: Comment-Driven Design

I started the NOTE: blog in 2009. It was a successor to the highly-popular email newsletter that I used to send between 2001 and 2006. At its height, the email newsletter had 4,000+ subscribers. One of the regular features was "SAS With Style". Below, I've included one from 2001 which still holds true and which I still practice today.

The focus of the tip is comments. Despite attempting to write unit specifications that provide sufficient detail of what is to be built and coded, I occasionally find that I have provided insufficient detail in some places (yes, I know, you're shocked!). In some cases it will be appropriate to revisit the documentation to augment it, but in others it may be pragmatic to include the detailed design in the code. Moreover, for those to whom external documentation is anathema, it is crucial that the comments in the code reveal the full rationale and intention of the design.

Jef Raskin wrote a good essay on the subject back in 2005. You can still find it on the Association for Computing Machinery (ACM) web site. It's entitled Comments are More Important than Code. Ed Gibbs added some of his own thoughts to the discussion in 2007 in his Musings of a Software Development Manager blog. Ralf Holly provides a neat, alternative summary of the topic in his 2010 blog entry. All three articles are worth a read.

My own tip from 2001 was more basic, but falls into the general approach discussed by Jef, Ed and Ralf. Here it is:
One of the less-attractive aspects of a programmer's life is maintaining existing code. Most programmers would prefer to be creating something new rather than manipulating old code. But maintaining old code is a necessity, be it your own code, or somebody else's. And in those circumstances, you will be grateful if the code has been written in a neat and clear fashion.

Comments are a critical part of your programs, and they can be used in many different ways. I like to encourage the use of "overview" blocks at the top of large sections (a whole program counts as a "large section"). The individual lines of the overview then get used to head-up the respective sections of code. The code might look like this:

/******************************************************/
/* 1. Get subset of the demog info                    */
/* 2. Get subset of the lab info                      */
/* 3. Get subset of the meds info                     */
/* 4. Merge demog, lab, and meds and transpose result */
/* 5. Create final transport file                     */
/******************************************************/

/***********************************/
/* 1. Get subset of the demog info */
/***********************************/
code to do the demog subseting

/***********************************/
/* 2. Get subset of the lab info   */
/***********************************/
code to do the lab subseting

/***********************************/
/* 3. Get subset of the meds info  */
/***********************************/
code to do the meds subseting

/******************************************************/
/* 4. Merge demog, lab, and meds and transpose result */
/******************************************************/
code to do the merge and transpose

/***********************************/
/* 5. Create final transport file  */
/***********************************/
code to do the proc cport

The overview block gives any maintenance programmer a great outline of the program and also acts as some kind of index. A general rule of thumb is to have between 6 and 12 sections (yes, I know the example breaks the rules). If the code in any of the sections is large, consider using a secondary level overview block to break it down further.

This style of commenting simply follows the oft-quoted rule of divide and conquer - break down your problem into small, manageable pieces and solve each of them in turn.
Putting aside my mis-spelling of "subsetting" (albeit, I was very consistent!), this eleven year old tip is still an approach that I frequently follow today.

Tuesday, 13 November 2012

NOTE: The Expert Channel at SAS Professionals

Next year's SAS Professionals Convention will be in Marlow, 10 - 12 July. If you're in the UK, or able to travel to the UK, it's one of the most valuable training events you can attend in 2013. And very reasonably priced too (£150 for three days in 2012). However, the SAS Professionals web site offers a lot of valuable information year-round, including the Expert Channel. The Expert Channel offers expertise direct to you on-demand and via interactive live sessions.

If you're not already a member of SAS Professionals, get yourself over to the web site and sign yourself up (for free) immediately! Members should take themselves to the Expert Channel group page and make sure they have joined (for free). And once you're in the group, click on the large blue "To Access the Expert Channel On Demand Click Here" graphic and get yourself to the Expert Channel Navigator page.

From the Navigator page, there are videos aplenty to view and learn from. One of the most popular series is SAS In 60 Seconds. This series is sub-divided into Base SAS, SAS Enterprise Guide, and SAS Web Report Studio. In each sub-division there are plenty of short (60 second) videos on key topics. The bite-size videos are a great way to pick-up new information.

Much of the other On Demand material on offer is derived from the live web sessions that are offered on a monthly basis. These recordings are usually closer to an hour in length. There's a large set of recordings in the  SAS Certification Tutorials sub-section. If you're planning to sit for any of the SAS certifications in 2013, you should check these out.

Depending on your circumstances (and your time zone), the live sessions might be more difficult to access. But it's good to know that the sessions are recorded and made available on demand. Yesterday's session was "SAS Certified Advanced Programmer for SAS 9 Tutorial", next Monday's will be "SAS Certified Base Programmer for SAS9 Tutorial", and this will be followed by "SAS BI Content Development for SAS 9 Tutorial" on Monday 26th November. Events continue into December with topics including Data Integration and Platform Administration. You can see the full programme in the Events section. If you plan to attend any events, be sure to register (it's free).

So, all-in-all there is a wide variety of quality material available. It's worth taking the time to get through the multiple steps required to join SAS Professionals and then join the Expert Channel group. And don't forget to make sure you've budgeted for SAS Professionals Convention 2013!

Monday, 12 November 2012

NOTE: More on Ishikawa

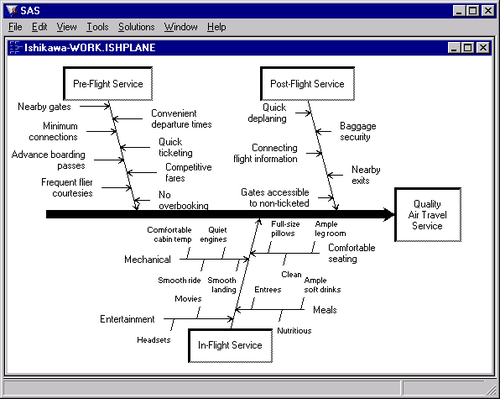
I recently mentioned the use of Ishikawa diagrams for assistance with problem solving. I have frequently found them to be of value. However, what I had never realised, until my friend Chris Brooks pointed it out, is that there's a PROC ISHIKAWA in SAS! It's part of SAS/QC (for Quality Control of processes), so that's my excuse; I've never used any PROCs from QC.

I recommend the creation of Ishikawa diagrams on paper (as part of a team process, using a white board or something similar). However, it can be useful to create an electronic copy after the event, and PROC ISHIKAWA may be the ideal tool for that purpose if you're licensed for SAS/QC.

PROC ISHIKAWA provides an interactive environment in which you can:

  • add and delete arrows with a mouse. You can also swap, copy, and so forth
  • highlight special problems or critical paths with line styles and colour 
  • display additional data for each of the arrows in a popup notepad 
  • display portions of the diagram in separate windows for increasing or isolating detail. You can also divide sections of the diagram into separate Ishikawa diagrams
  • merge multiple Ishikawa diagrams into a single, master diagram 
  • display any number of arrows and up to ten levels of detail 
  • foliate and defoliate diagrams dynamically 
  • save diagrams for future editing 
  • save diagrams in graphics catalogs or export them to host clipboards or graphics files 
  • customise graphical features such as fonts, arrow types, and box styles
Who knew?!

Thanks for the tip, Chris. Recognition at last ;)

Saturday, 10 November 2012

Now That's What I Call Data Visualisation!

This video from the McLaren Formula 1 team is artistic as well as informative. The film merges photography, animation and sculpture and is a truly unique way of representing aerodynamics.

The car in question is the McLaren P1 supercar from McLaren Automotive.

Will this technique be available in SAS? Version 10 in 2014?! [just kidding]

Tuesday, 6 November 2012

NOTE: SGF 2013 Obsession #sasgf13

I think I'm becoming a bit obsessive about SAS Global Forum 2013, to be hosted by San Francisco. I mentioned a couple of months back how the sound of The Flower Pot Men had been floating around my head - Let's Go To San Francisco. I realised last night that I've been watching a lot of San Francisco based movies recently. Is this healthy?!

It started when we got a trial Netflix subscription and I watched Clint Eastwood in Escape from Alcatraz (on our TV via my son's Xbox). I'm not a great movie watcher, but I did enjoy the film and it inspired me to try-out some movies from the Google Play store and watch them on my Android tablet. It was a positive experience. It was easy to rent the movies, and the playback on the tablet was good. And, I noticed that I can stream them or I can download them. With 30 days in which to watch them, I noted the fact that I could download a number of movies onto my tablet and watch them during my journey to/from SAS Global Forum.

What movies have I watched on my tablet? Well I continued the action theme by watching Steve McQueen in Bullitt, then I returned to Clint Eastwood in Dirty Harry, and then I saw The Maltese Falcon. None of them new, but all classics. It was while I was watching The Maltese Falcon that I realised that all four films were set in San Francisco. I hadn't deliberately set out to watch San Franciscan films.

My favourite? It has to be Bullitt. I'm a petrol head and I loved McQueen's Mustang. Just the sound of the engine was heavenly.

Is all this interest in San Francisco healthy? I'm not sure, but I've enjoyed the films, and I'm looking forward to learning lots at SAS Global Forum next year, so it can't be all bad.

Monday, 5 November 2012

Debugging With Six Sigma Ishikawa

Back in September 2009 (that seems so long ago!) I wrote an article on problem solving using the 5 Whys technique. Some correspondents suggested that 5 Whys was a trivial/obvious technique, but they were missing the point somewhat - sometimes we overlook the obvious and need reminding of it, and sometimes the simplest techniques can provide the most valuable results.

That said, no one technique is guaranteed to work in all circumstances, so I thought I'd offer another technique that I use quite frequently: Ishikawa Diagrams, another part of the Six Sigma tool kit. They're sometimes known as cause-and-effect diagrams or herringbone diagrams. Again, they appear simplistic; and once again, I say beware of dismissing the simple and obvious! As with 5 Whys, the interaction between the people using the technique is perhaps the heart of the process, but the process guides and facilitates the discussion and discovery of information. Like 5 Whys, Ishikawa diagrams will help you to get to the root cause of your issue.

To use an Ishikawa diagram:

A) Determine a clear, brief description of the issue. Write it at the head of the fish bone skeleton, on the end of the spine

B) Decide the major categories for causes and create the ribs of the skeleton, writing one category at the end of each rib bone. These vary depending upon the industry and the situation in which the Ishikawa diagram will be used. I generally use a variation of the 6 Ms (used in manufacturing industries):


MDescriptionRecommendation for SAS
MachineEquipment / TechnologyHardware or software
Method ProcessProcess
Material Includes Raw Material, Consumables and InformationData
Man Power Physical work / Mind Power (brain work)People
Measurement InspectionInspection
Mother Nature EnvironmentEnvironment (physical or logical)

C) Now challenge the assembled group to contribute possible causes under each of the major categories. There are many ways to do this, such as by brainstorming or by asking each person to contribute one suggestion for each major category. Place each suggestion alongside the associated rib. As with mind-mapping, you might want to divide and sub-divide your suggestions. Remember, at this stage we're looking for potential causes, not solutions

D) Now review the diagram. Remove any suggestions which clearly don't apply to the specific issue at-hand, and try to garner further suggestions for categories where there are fewer suggestions. To drive down to the root cause, it may be appropriate to adopt a 5 Why approach for each suggestion

E) Discuss the diagram and agree the causes that you all think are the most likely to be at the root of the issue. It's okay to rely on experience and instincts at this point

F) Finally, develop plans to confirm that the potential causes are the actual cause. It is important to concentrate on proving the root cause before taking action to resolve the issue

Ishikawa diagrams are a great way to engage all participants and get a balanced list of ideas. They provide structure for any review session, and they encourage participants to push beyond symptoms to uncover potential root causes. However, you'll get the best results if you have a precise problem definition at the start of the review session.

If you look carefully, you can find tools for drawing nice, neat Ishikawa diagrams but, in my opinion, you can't beat getting a group of people armed with marker pens and sat around a whiteboard or drawing board. The human interaction is an important part of the process.

First documented by Kaoru Ishikawa in the late 1960s, Ishikawa diagrams are a firm part of many sets of practices including Six Sigma and ITIL. Highly recommended.

Thursday, 1 November 2012

NOTE: SAS Mobile BI on Android

I see that SAS Mobile BI is now available for download from the Google Play store for Android-loving folk like myself. This is in addition to its earlier Apple incarnation. It's good to see SAS keeping to its promise of supporting multiple platforms.

It only appeared yesterday, so there's not been many downloads yet, but I'll follow its popularity with interest. It's a shame I don't have a SAS server I could test it from.